Tutorials#
These tutorials walk you through using Pyriodic for circular data analysis, from getting started to phase diagnostics and circular statistics.
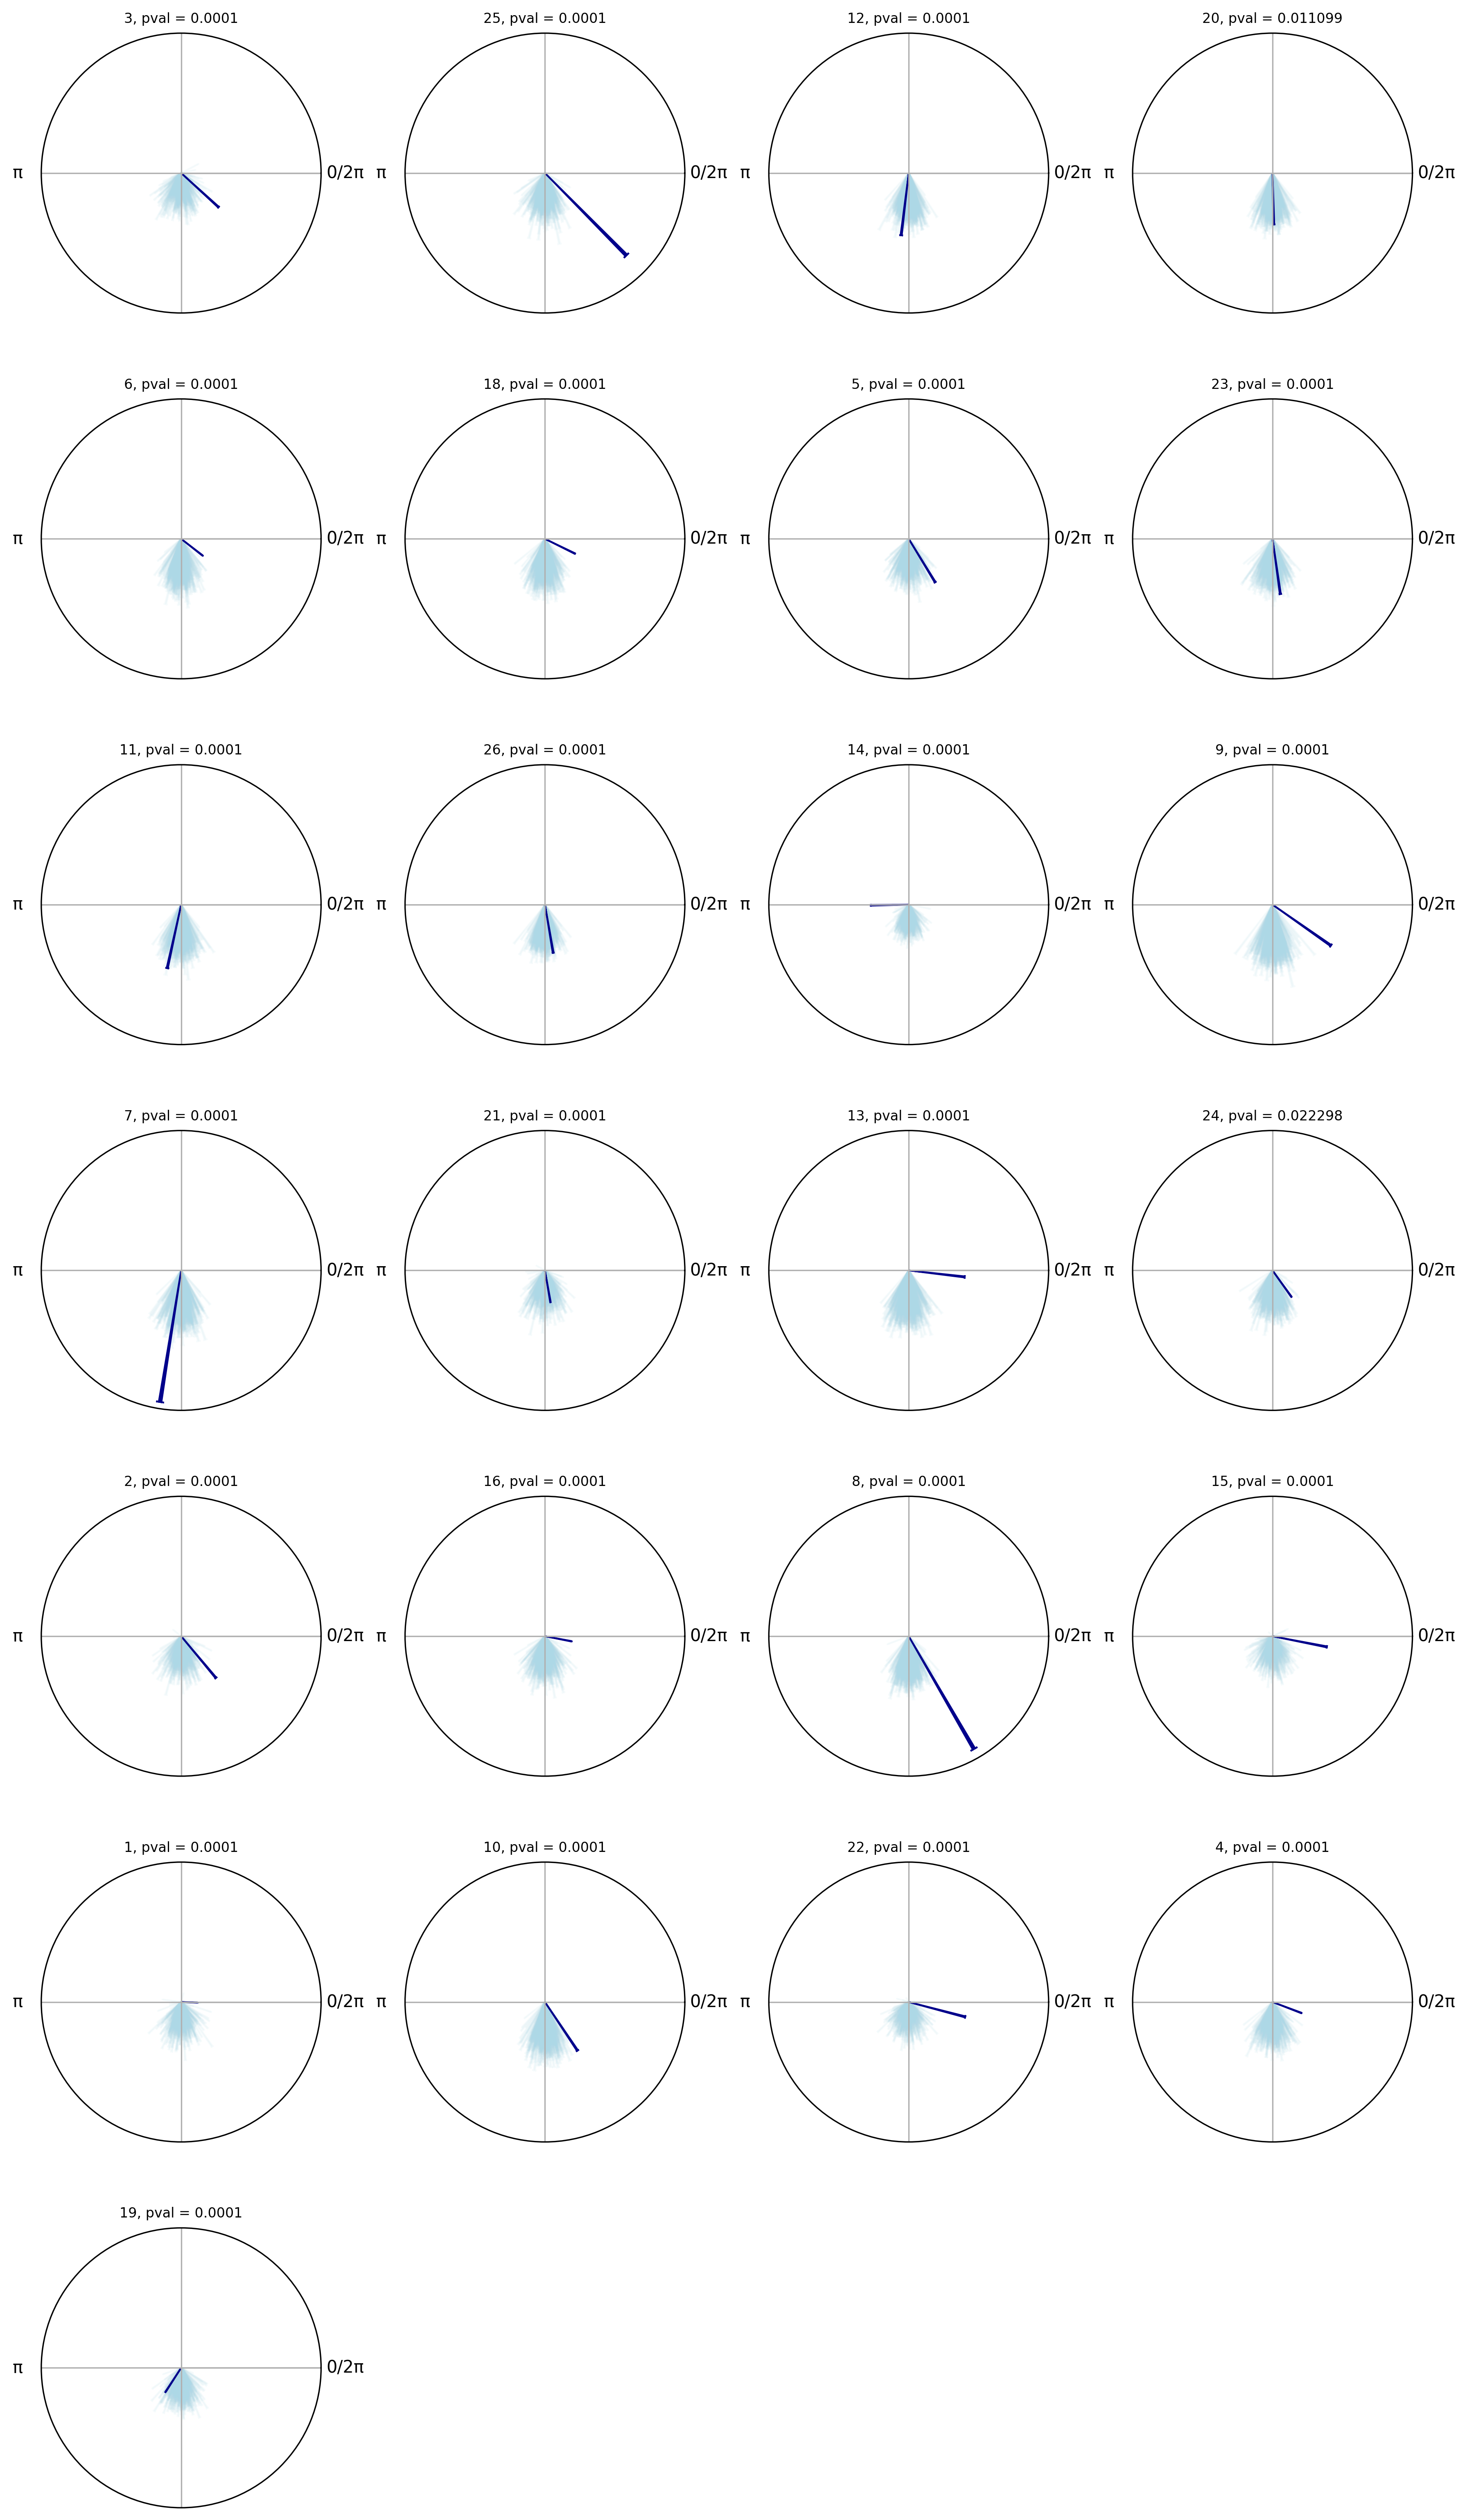
Permutation test between observed samples and surrogate samples (peak-to-peak shuffled)
In this tutorial, we will perform a permutation test between observed samples and surrogate samples (peak-to-peak shuffled) to assess whether the observed samples are significantly different from what would be expected by chance.
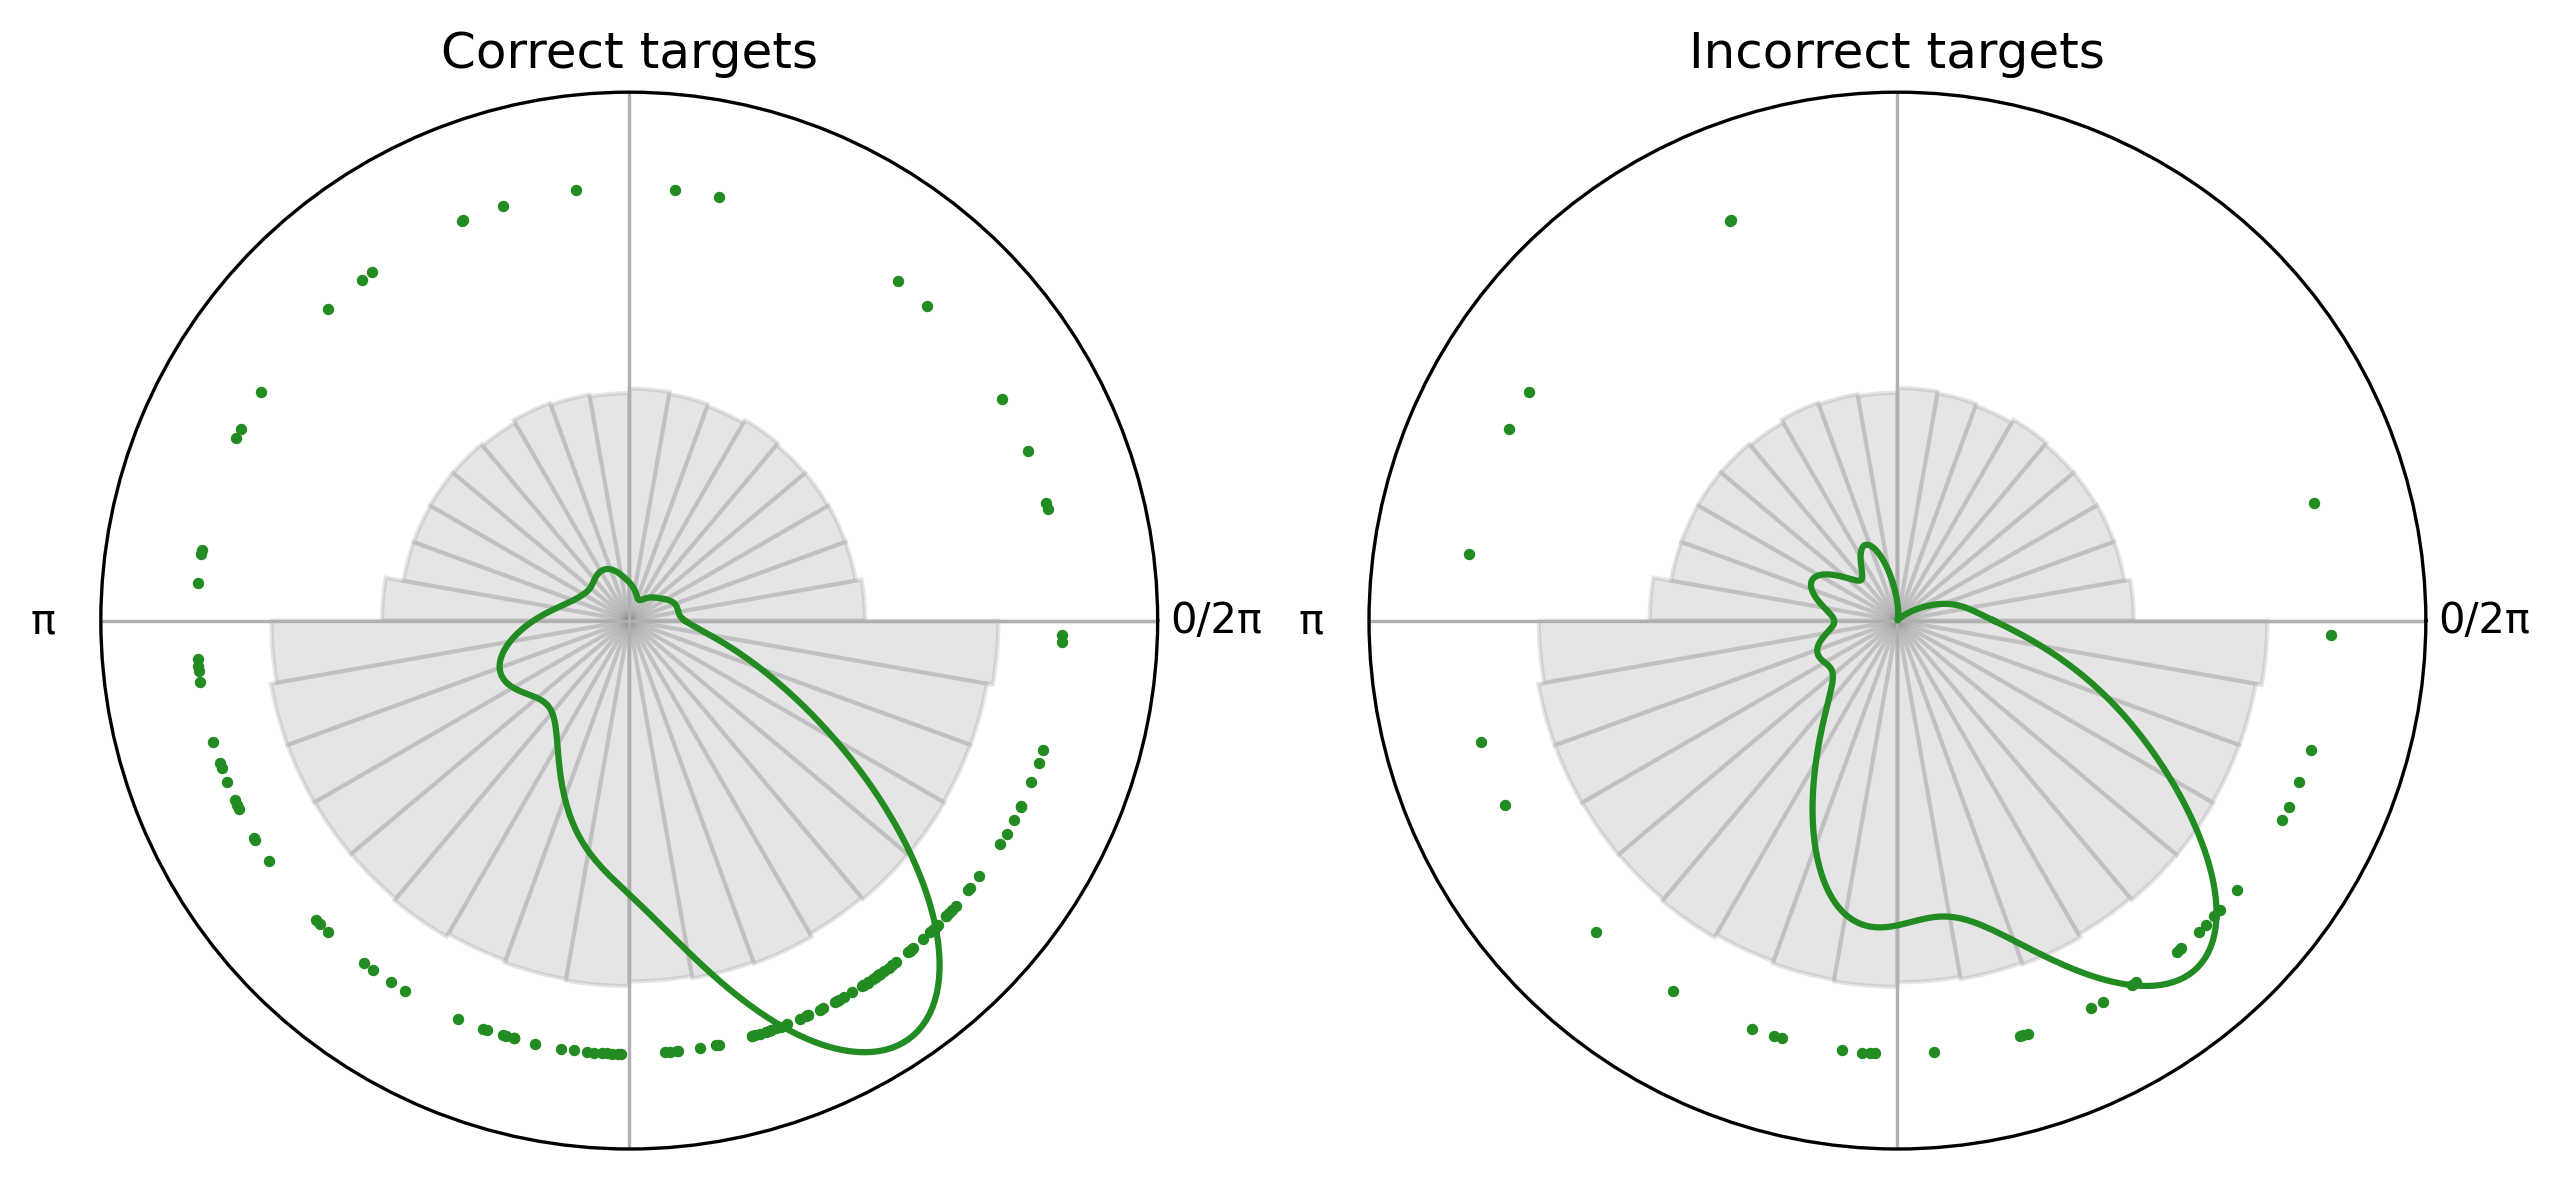
Group-level permutation test between observed samples and surrogate samples (peak-to-peak shuffled)
In this tutorial, we will perform a permutation test between observed samples and surrogate samples (peak-to-peak shuffled) at group level to assess whether the observed samples are significantly different from what would be expected by chance.

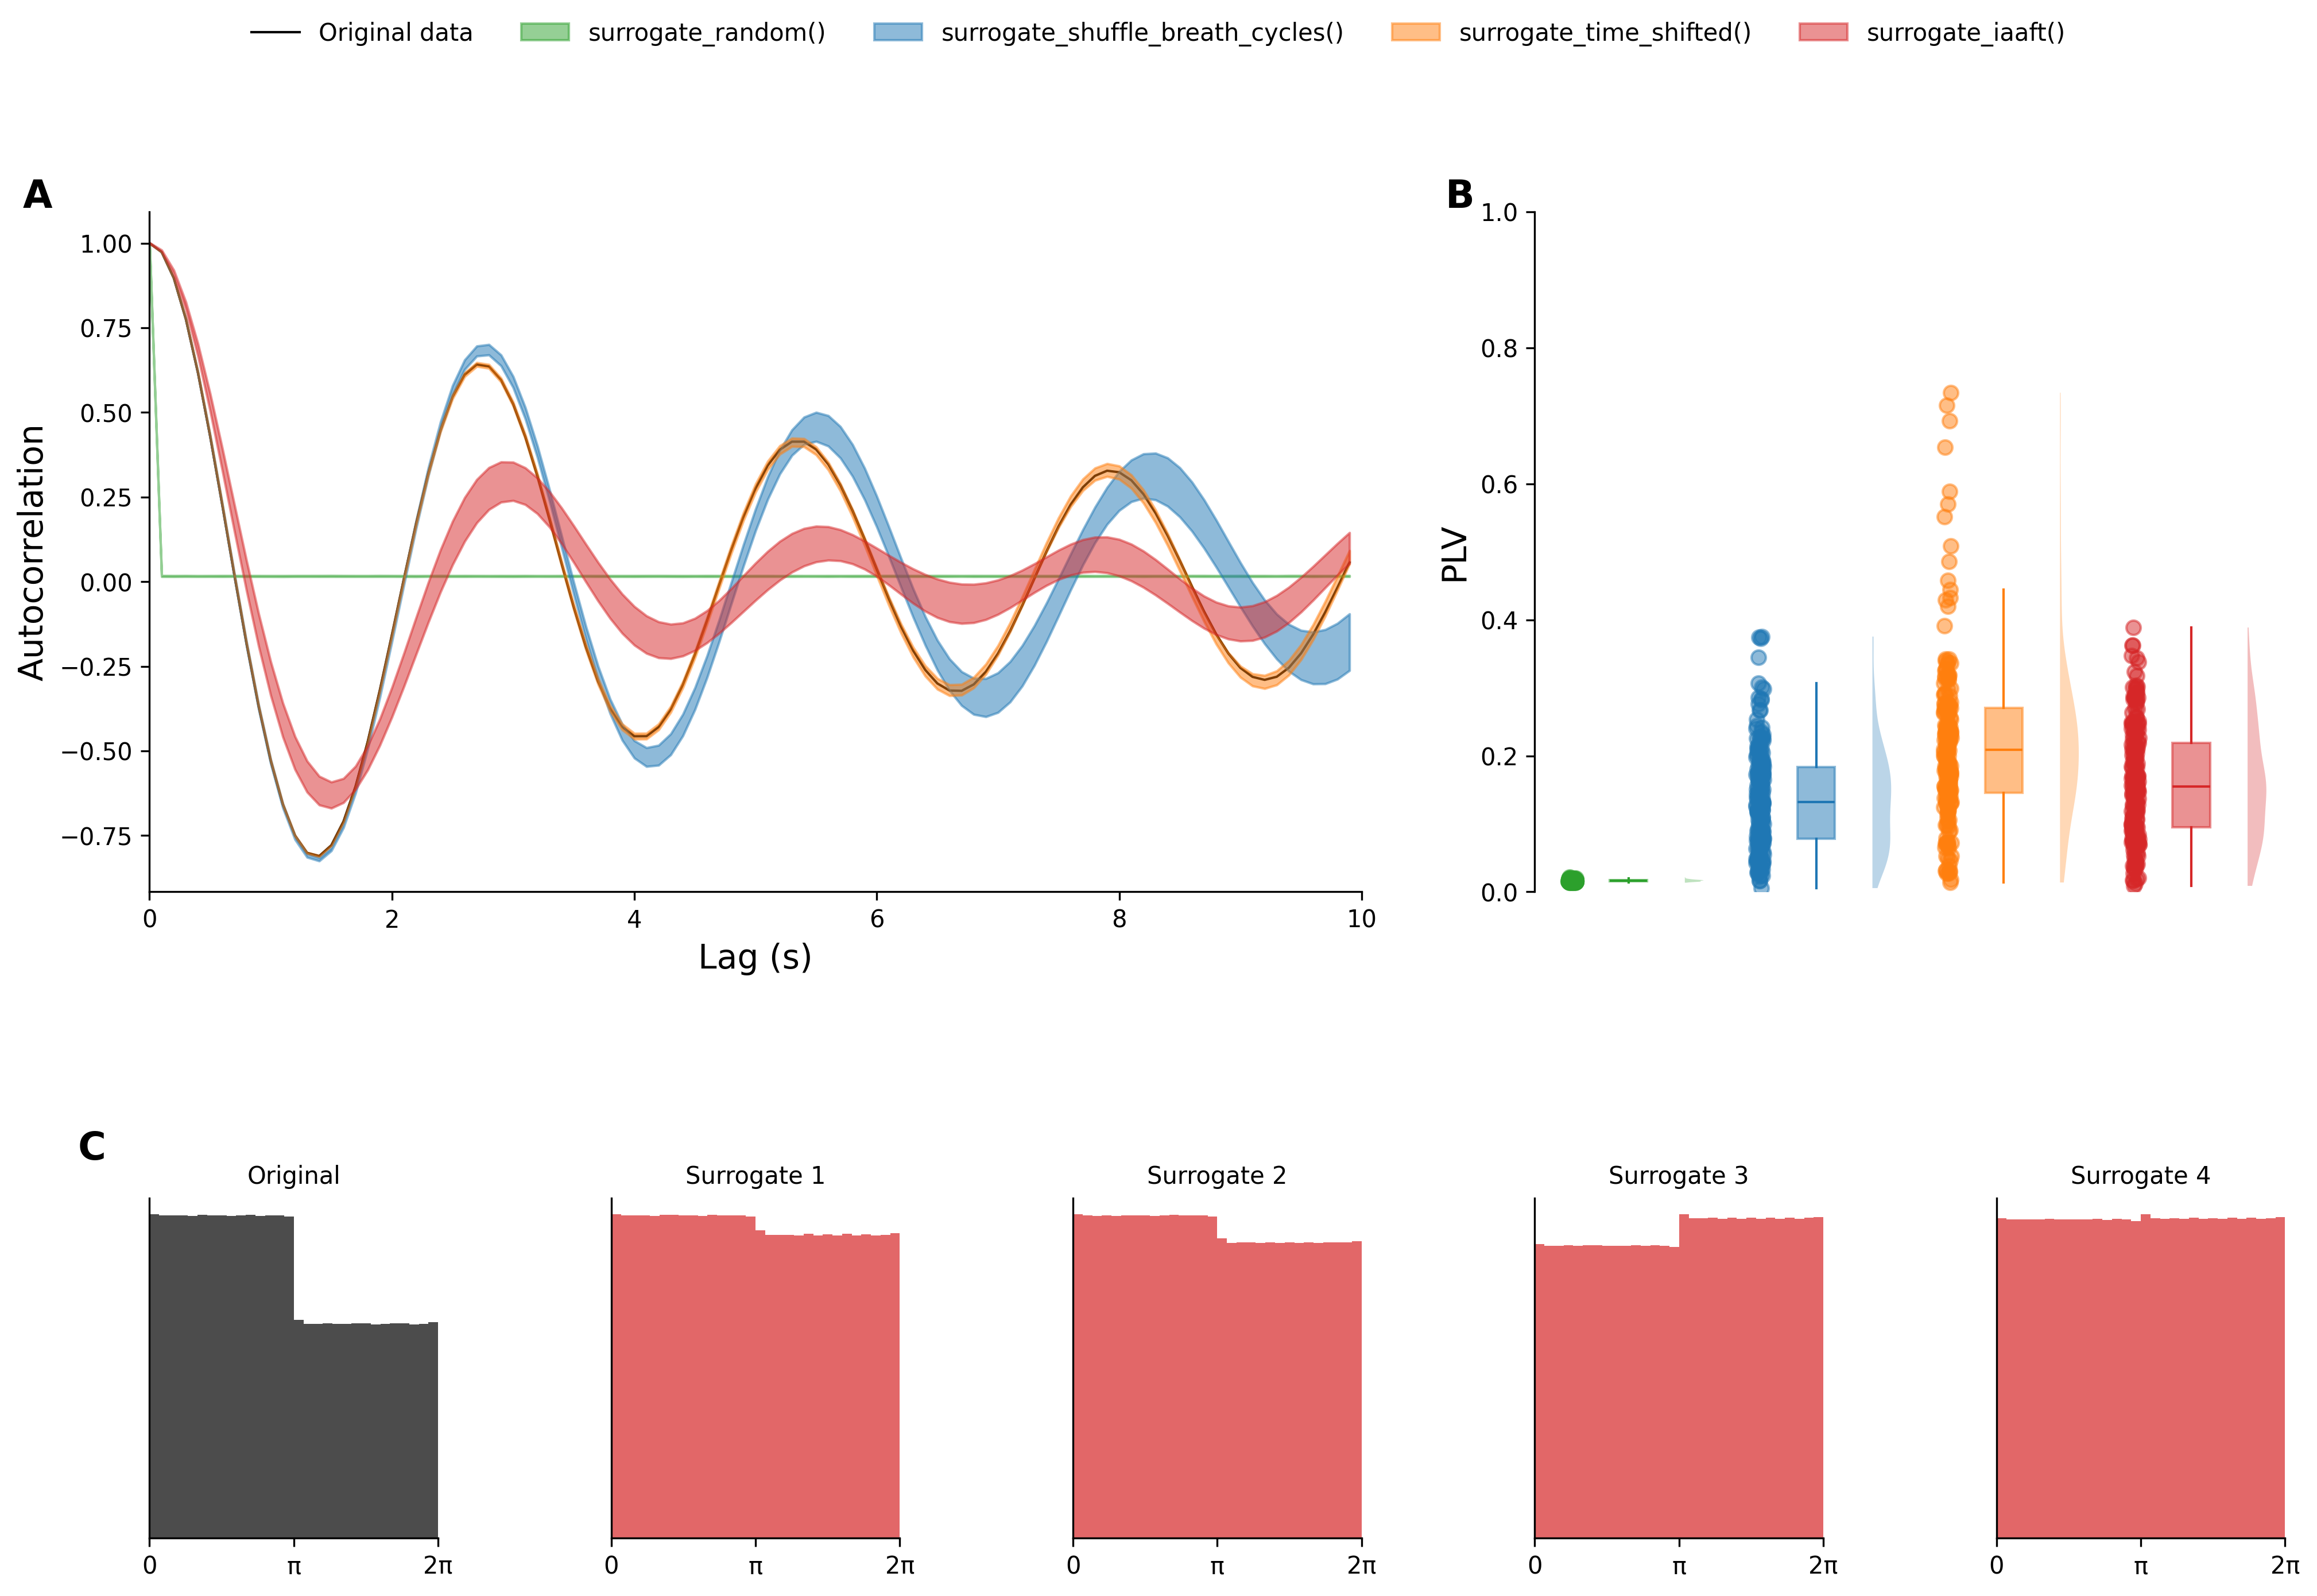
Generating surrogate data for inference
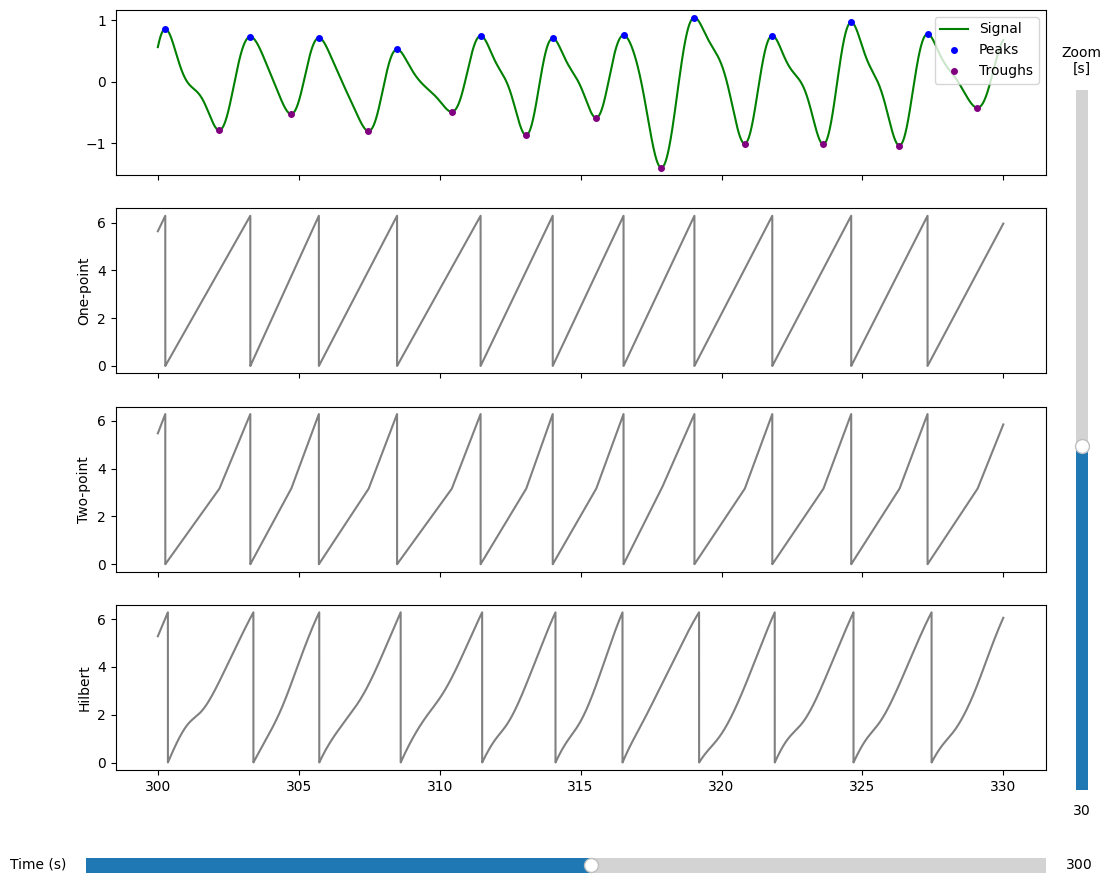
There are many ways to generate surrogate data for inference. Here we introduce and compare several methods. What is important to note is that the surrogate data should be generated in a way that preserves the null hypothesis. For example, if we are testing for a specific pattern in the data, the surrogate data should not contain that pattern. This means, that the choise of surrogate data depends on the hypothesis being tested. Furthermore, it can depend on how phase angles are extracted from the data, as different methods for extracting phase angles can lead to different distributions of phase angles.