Two sample permutation test of respiratory phase angles#
This notebook runs permutation tests to compare two samples of respiratory phase angles. This is useful when you want to compare the phase angles of two different conditions or groups.
[1]:
import pickle as pkl
import numpy as np
from pathlib import Path
import matplotlib.pyplot as plt


from pyriodic.viz import CircPlot
from pyriodic.preproc import RawSignal
from pyriodic.permutation import permutation_test_between_samples
from pyriodic.phase_events import create_phase_events
from pyriodic.datasets import sample
/Users/au661930/Library/CloudStorage/OneDrive-Aarhusuniversitet/Dokumenter/projects/_BehaviouralBreathing/code/AnalysisBreathingBehaviour/BreathingBehaviourVenv/lib/python3.13/site-packages/tqdm/auto.py:21: TqdmWarning: IProgress not found. Please update jupyter and ipywidgets. See https://ipywidgets.readthedocs.io/en/stable/user_install.html
  from .autonotebook import tqdm as notebook_tqdm
Single-level analysis#
[2]:
path = sample.data_path()

with open(path, "rb") as f:
    data = pkl.load(f)

behav_data = data["behav_data"]
resp_ts, sfreq, event_samples, event_ids, labels, correct = data["resp_ts"], data["sfreq"], behav_data["event_samples"], behav_data["event_ids"], behav_data["event_type"], behav_data["correct"]
[3]:
start_sample = event_samples[0] - 1000  # start 1000 samples before the first event

# subtract start sample from events (the first column)
event_samples -= start_sample
resp_ts = resp_ts[start_sample:]  # crop the respiratory signal to start at the first event

# initialise RawSignal object
raw = RawSignal(resp_ts, fs=sfreq)
raw.filter_bandpass(low=0.1, high=1.0)
raw.smoothing(window_size=500)
raw.zscore()

PA, peaks, troughs = raw.phase_twopoint(prominence=0.1)
Choosing events of interest and plotting the two samples#
[4]:
correct_event_samples = [
    samp for samp, label, corr in zip(event_samples, labels, correct) if "target" in label and corr == 1.0
]

correct_targets = create_phase_events(
    PA, events=correct_event_samples
)

incorrect_event_samples = [
    samp for samp, label, corr in zip(event_samples, labels, correct) if "target" in label and corr == 0.0
]
incorrect_targets = create_phase_events(
    PA, events=incorrect_event_samples
)
Rejected 0 out of 330 events (0.0%)
Rejected 0 out of 58 events (0.0%)
[5]:
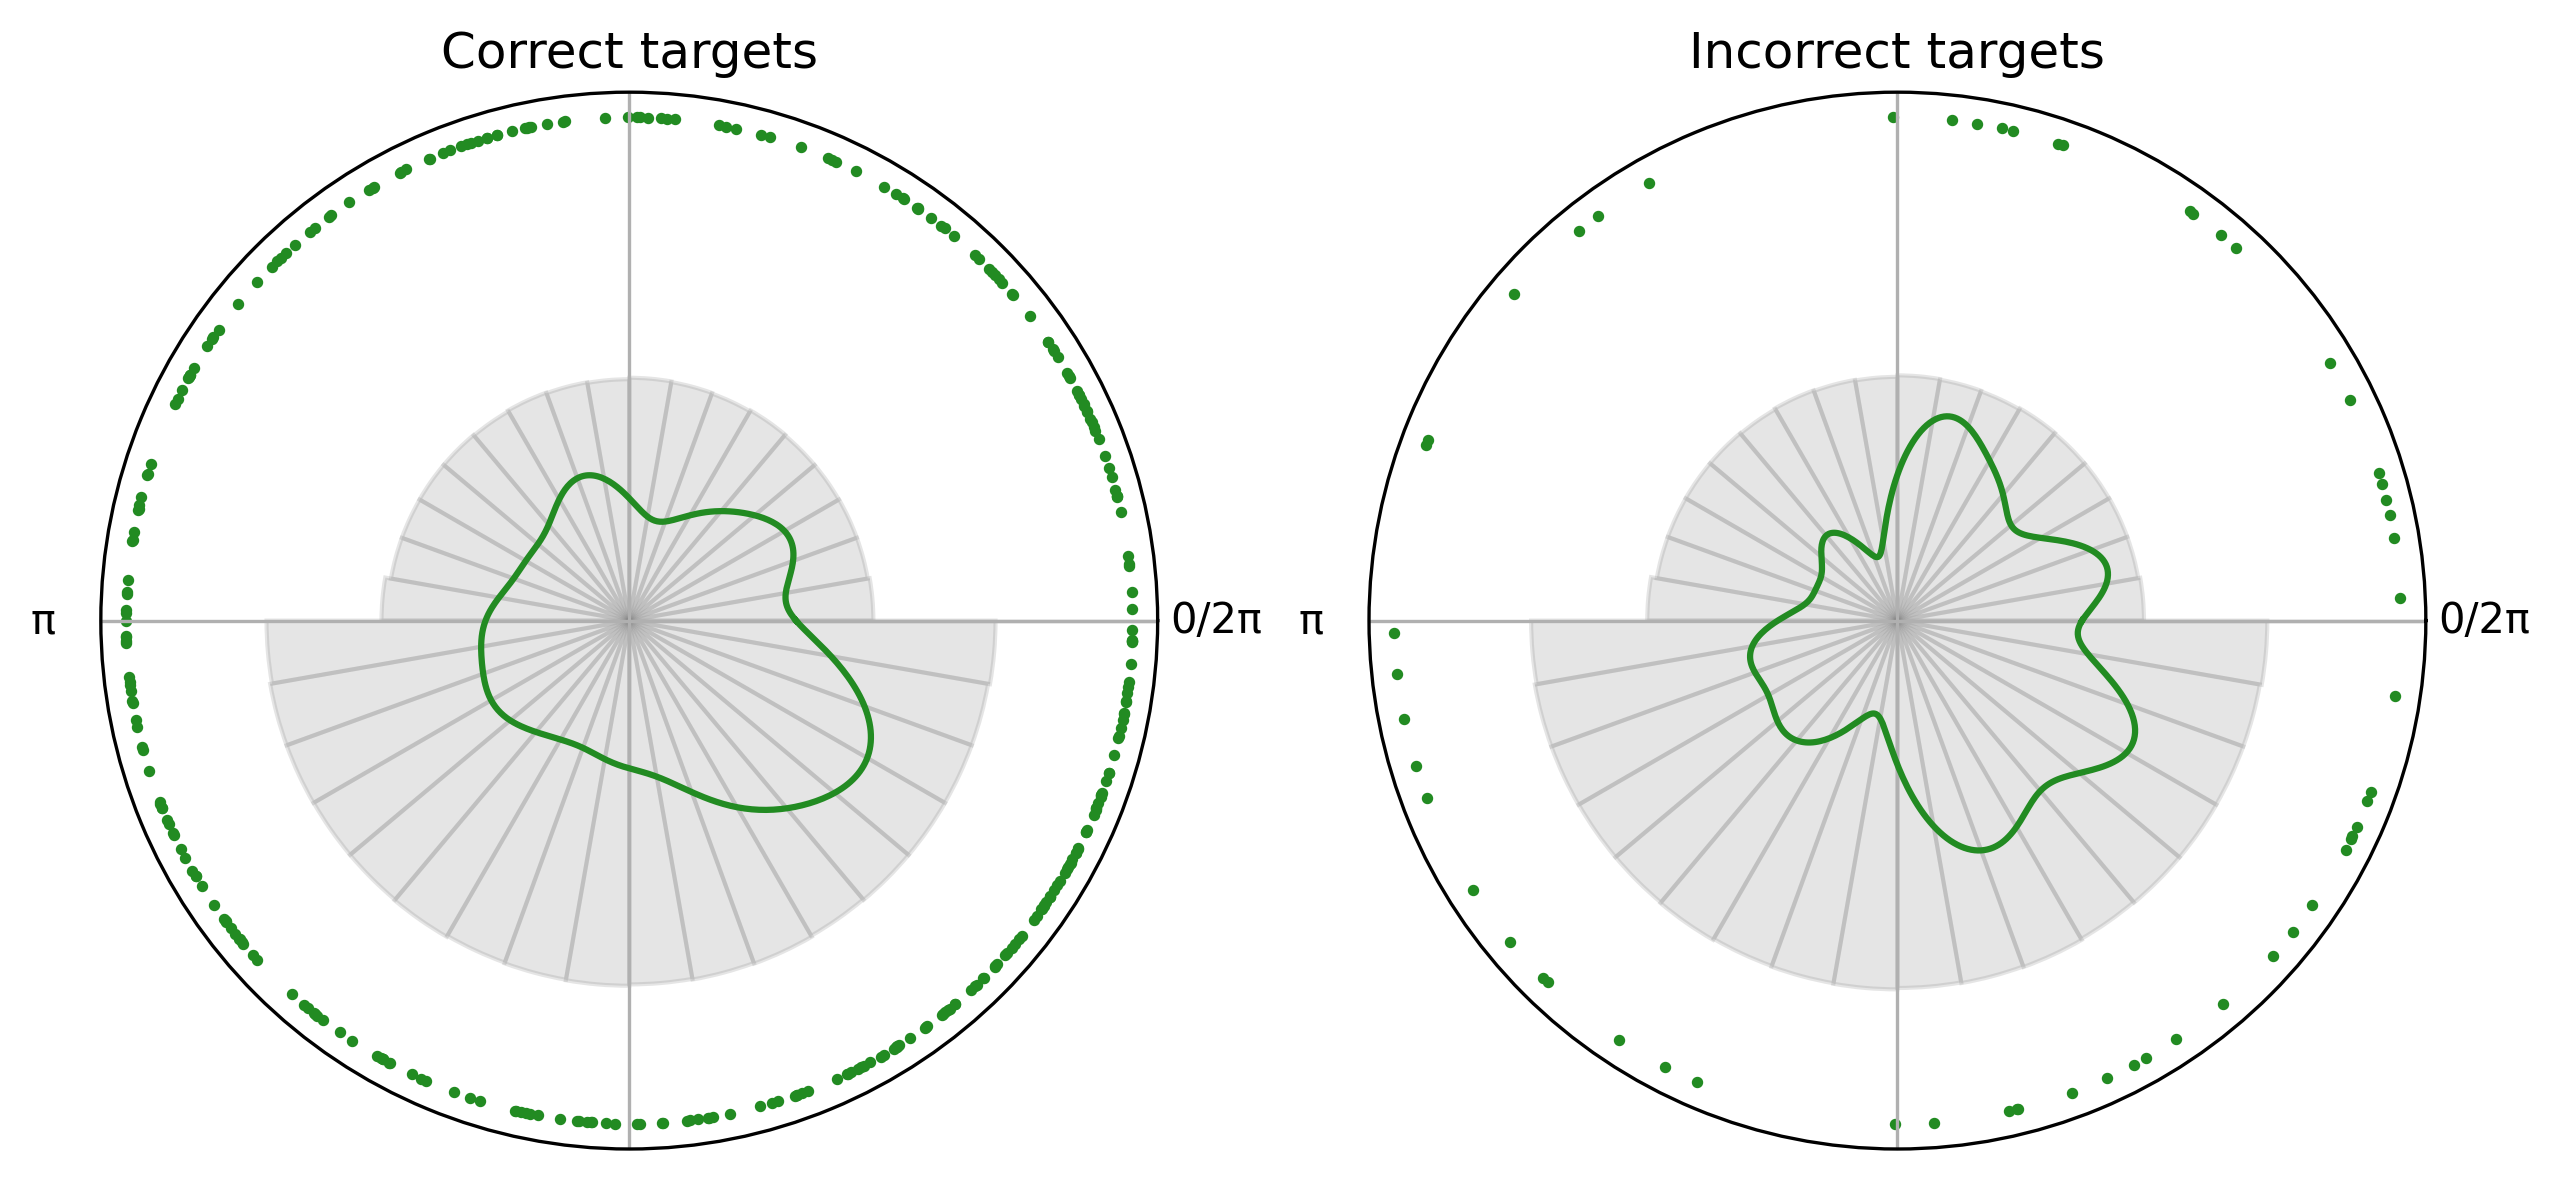
fig, axes = plt.subplots(1, 2, dpi = 300, figsize = (10, 6), subplot_kw={"projection": "polar"}, sharey=True)

correct_plot = CircPlot(
    correct_targets,
    title = "Correct targets",
    group_by_labels=False,
    ax=axes[0]
)
correct_plot.add_points(s=3)
correct_plot.add_density()
correct_plot.add_histogram(PA)


incorrect_plot = CircPlot(
    incorrect_targets,
    title = "Incorrect targets",
    group_by_labels=False,
    ax=axes[1]
)
incorrect_plot.add_points(s=3)
incorrect_plot.add_density()
incorrect_plot.add_histogram(PA)
[6]:
# Run permutation test
obs_stat, pval = permutation_test_between_samples(
    correct_targets.data,
    incorrect_targets.data,
    n_permutations=10000
)
Observed statistic = 0.055, p = 0.6225